This appendix gives the statistics behind "What the numbers show" in the main report: the data, the tests, every result, the charts and the limits. It tests timing in public counts, which measure discovery, confirmation or reporting, not when or how attacks happened. It cannot show who was behind any attack, or that ARTEX or anyone else caused any incident or outage.
An analysis of public attack data found no statistical evidence linking ARTEX, the autonomous hacking tool published on GitHub on July 26, 2026, to the rise in recorded attack activity, though with about 20 weeks of data only a strong link could have been detected.
In the 16 weeks after its release CISA added 128 actively exploited flaws to its catalog of known exploited vulnerabilities (KEV) and ransomware gangs posted 3,682 victims on leak sites, more than in earlier years. But both series had been climbing for years.
The totals were higher than a model of each series' growth and seasons forecast: KEV by about 29%, ransomware posts by about 11%. Both stayed within that model's range of normal fluctuation. With a 2025-only baseline, the KEV excess is borderline.
Neither series shows a detectable break at the release date. A jump in press-reported attacks logged by the tracker began in June, before ARTEX was published, and may reflect faster logging rather than more attacks.
One narrow measure, exploited flaws in network-edge appliances, their management consoles and email gateways, did rise well above forecast (27 against about 7). The consoles and gateways, which do not appear in the same weeks of earlier years, began appearing earlier in 2026. The appliances themselves, such as firewalls, VPN gateways and routers, numbered 18 after the release, against 5 in the 16 weeks before and 13, 5 and 5 in the same weeks of 2023-2025.
That measure was defined during the analysis and does not survive the strictest correction for the many tests run, and the data cannot say why it rose or who exploited the flaws.
GitHub copies and forks of ARTEX, almost all made from the week of October 5, around its developer's October 8 statement that it had gone closed-source, moved no more in step with attacks than unrelated popular software did.
The three questions
We asked three questions of public data, measured from ARTEX's publication on GitHub on July 26, 2026, the date Censys gives.
- Timing. Did recorded attack activity change at the release, from that point on?
- Size. Was any rise bigger than each series' normal growth and ups and downs?
- Spread. Did ARTEX's spread on GitHub track attacks more closely than the adoption of unrelated software?
The data
The attack and GitHub data are public and were pulled on November 18, 2026, between about 02:00 and 03:00 UTC (the evening of November 17, US time). November 17 is the last complete day; the latest days are provisional because the trackers add entries late.
- CISA's Known Exploited Vulnerabilities catalog (KEV), version 2026.11.17, 1,782 entries. We use the date CISA confirmed exploitation and listed each flaw, not when attacks began; several flaws in one product are often listed on the same day.
- ransomware.live leak-site posts: 33,517 victim posts since January 2021. They count extortion posts, not break-ins, lag intrusions by days to months, and grow as the tracker follows more gangs.
- ransomware.live press-reported attacks: 4,403 attacks, dated by the attack. Entries are often added late (median 16 days; a quarter take 152 days or more), so we count only attacks logged within 14 days, a series comparable from 2024 and complete to November 3, 2026.
- GitHub: 858 repositories created from July 1 to November 18, 2026 that mention ARTEX, 394 of them about the tool, and weekly counts of forks named "artex". Some are defensive projects, so they measure interest, not use; the original repository, Autumn-27/ARTEX, returns "not found", so its own uptake cannot be measured.
- Comparison software: 15 popular projects unrelated to security and 6 security tools, all created between June 15 and August 15, 2026, chosen by fixed rules and measured by weekly new forks.
How we tested it
Each step is in plain terms first, then the technical detail in the shaded note.
A p-value is the chance of a result at least this extreme if nothing unusual were going on. Smaller means more surprising; 0.05 is a common cut-off.
Windows and comparisons
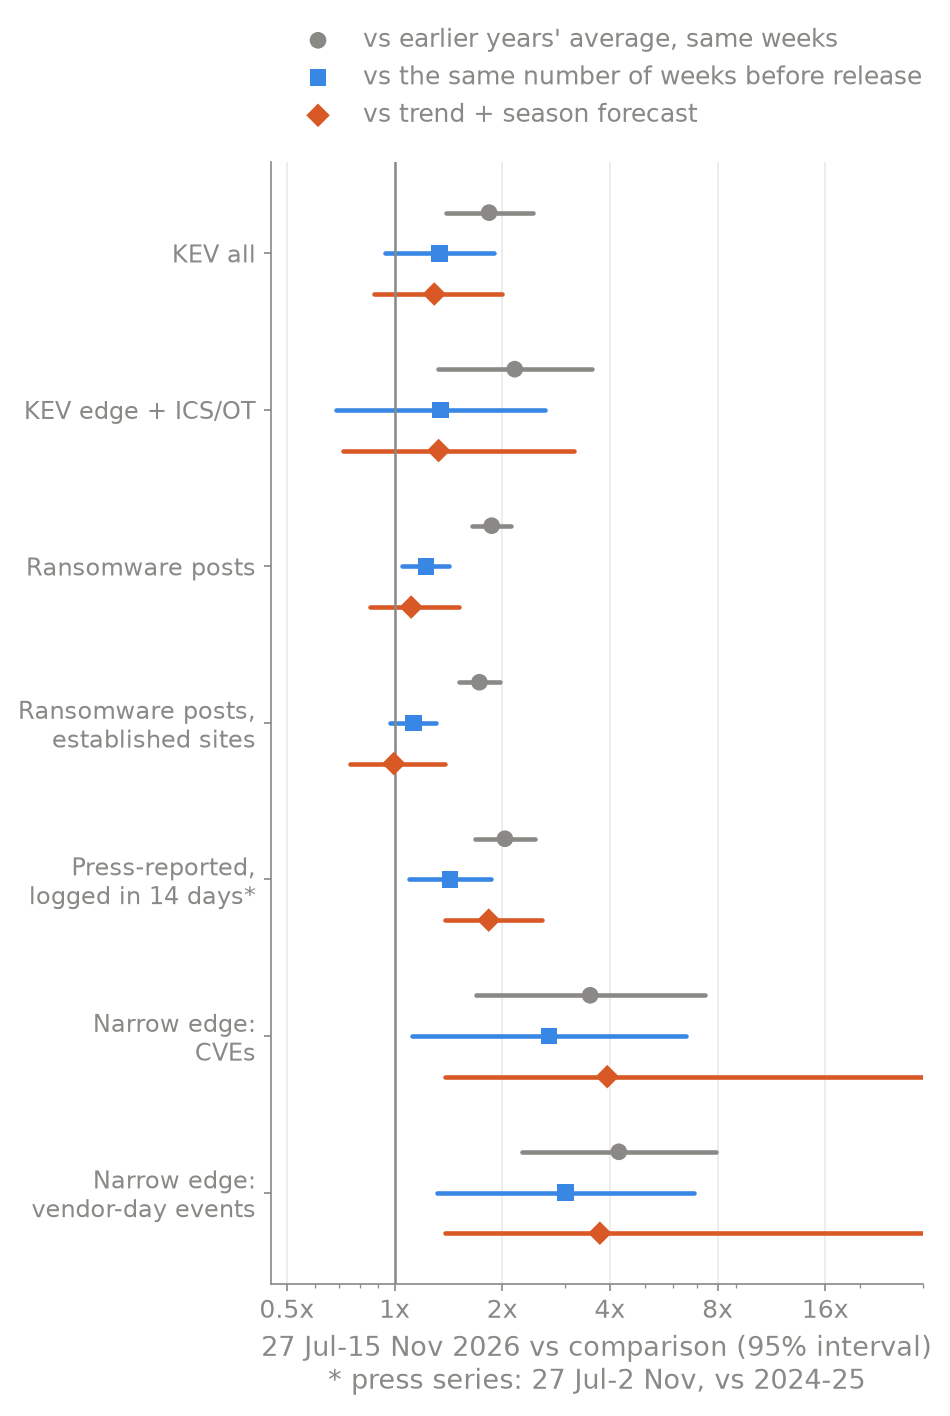
We compare the 16 full weeks after the release (July 27 to November 15) with the same weeks of 2023 to 2025, and with the 16 weeks before the release. Any growing series looks higher on both, so the main test is a forecast: a model fitted to each series up to the release learns its growth and seasonal pattern, and we ask whether the weeks after fall outside the range it expects.
Weeks run Monday to Sunday, UTC; the press series has 14 complete weeks (to November 1). Rate ratios are quasi-Poisson, shown beside a 95 percent range for one new year from the earlier years' log totals. The forecast is a weekly negative binomial (NB2) regression with a linear trend and two annual harmonics, fitted from 2023 (2024 for the press series) to the week of July 20, 2026, with 95 percent ranges from 100,000 simulations widened for autocorrelation at lags 1 to 4, and one-sided p.
A turning point at the release?
If a new tool changed attack activity, counts would step up from the release on. We test a step at the release week against no step, and try every week from mid-2024 to see where the release week ranks.
Segmented NB2 regression from 2024 with a level step and slope change; likelihood-ratio test with 2 degrees of freedom; 116 candidate weeks. A simpler level-step model (118 to 120 weeks) dates the best single step; its p-value ignores the search, so it is descriptive.
ARTEX against unrelated software
Any two things that grow over the same months look related, so we ask whether ARTEX tracks attacks more closely than 15 popular projects unrelated to security. If it were no different, it would rank in the top two of the 16 about one time in eight.
20 weeks from June 29, 2026 (18 for the press series), counts as log(1 + count). Correlations of cumulative totals, weekly values, week-on-week changes and trend-removed values, with ARTEX leading by 0 to 4 weeks (0 to 8 as a sensitivity check); the 6 security tools are shown for context only.
Allowing for many tests
Run enough tests and some look significant by luck. We adjusted all 70 p-values two ways: Holm's strict method keeps the chance of even one false alarm below 5 percent, and the looser Benjamini-Hochberg method keeps the expected share of false alarms among flagged results below 5 percent.
32 of the 70 are anomaly tests (forecasts and break tests). Rate ratios against earlier periods are expected to be significant in growing series and say nothing about ARTEX.
Was the rise bigger than normal growth?
Every main series was higher than in the same weeks of earlier years, as expected in series that grow: built into the forecasts, KEV additions grew about 19.1 percent a year since 2023, KEV entries from network-edge and industrial vendors about 31.3 percent, and ransomware posts about 27.4 percent.
Against the forecast, KEV additions ran 29.1 percent above (128 against 99.1, p 0.10) and ransomware posts 11.3 percent above (3,682 against 3,309, p 0.22): higher, but within normal fluctuation. Two measures sit outside their forecast range: the press series, whose shift began in June, and the narrow edge-device count, covered below.
| Series | 2026 total (2023 / 2024 / 2025) | Against earlier years' average [95% CI] | Range for a normal year | Against the weeks before [95% CI] | Forecast (95% range) | Above forecast | p |
|---|---|---|---|---|---|---|---|
| KEV, all | 128 (59 / 78 / 72) | 1.84 [1.39 to 2.43] | 34 to 141 | 1.33 [0.94 to 1.89] | 99.1 (64 to 146) | 29.1% | 0.10 |
| KEV, edge and industrial vendors | 39 (18 / 19 / 17) | 2.17 [1.32 to 3.55] | 14 to 24 | 1.34 [0.69 to 2.64] | 29.4 (12 to 54) | 32.8% | 0.19 |
| Ransomware posts | 3,682 (1,704 / 1,771 / 2,437) | 1.87 [1.65 to 2.12] | 733 to 5,159 | 1.22 [1.05 to 1.42] | 3,309 (2,430 to 4,327) | 11.3% | 0.22 |
| Ransomware, established sites | 2,773 (1,352 / 1,569 / 1,897) | 1.73 [1.51 to 1.97] | 684 to 3,697 | 1.13 [0.97 to 1.31] | 2,787 (2,003 to 3,696) | -0.5% | 0.50 |
| Press, logged within 14 days | 296 (2024 / 2025 only: 161 / 130) | 2.03 [1.68 to 2.47] | 14 to 1,522 (two earlier years only: uninformative) | 1.43 [1.10 to 1.86] | 161 (115 to 214) | 83.3% | < 0.002 |
| Narrow edge, CVEs | 27 (13 / 5 / 5) | 3.52 [1.68 to 7.37] | 0 to 107 | 2.70 [1.12 to 6.54] | 6.9 (0 to 19) | 293.2% | 0.003 |
| Narrow edge, vendor-day events | 24 (8 / 5 / 4) | 4.24 [2.27 to 7.90] | 1 to 31 | 3.00 [1.31 to 6.86] | 6.4 (0 to 17) | 274.9% | < 0.002 |
July 27 to November 15, 2026; press series July 27 to November 1, against 2024 and 2025 only. "Established sites" counts only leak sites the tracker had followed for at least 90 days.
The KEV verdict depends on where the model starts: from 2025, KEV additions sit at the edge of the normal range (p 0.047); from 2023 or 2024, they do not.
| Series | Model from 2023: expected, p | From 2024 | From 2025 |
|---|---|---|---|
| KEV, all | 99.1, p 0.10 | 112, p 0.26 | 85.5, p 0.047 |
| KEV, edge and industrial vendors | 29.4, p 0.19 | 28.5, p 0.19 | 21.5, p 0.082 |
| Ransomware posts | 3,309, p 0.22 | 3,474, p 0.32 | 3,189, p 0.13 |
| Press, logged within 14 days | not available | 161, p < 0.002 | 177, p < 0.002 |
| Narrow edge, CVEs | 6.9, p 0.003 | 5.3, p < 0.002 | 4.1, p < 0.002 |
| Narrow edge, vendor-day events | 6.4, p < 0.002 | 5.1, p < 0.002 | 3.1, p < 0.002 |
Among all 16-week windows since 2023, the post-release window ranks 2nd of 187 for KEV additions and 1st of 187 for ransomware posts. Recent windows rank near the top in any growing series, so these ranks describe the level, not an anomaly.
Did anything change at the release date?
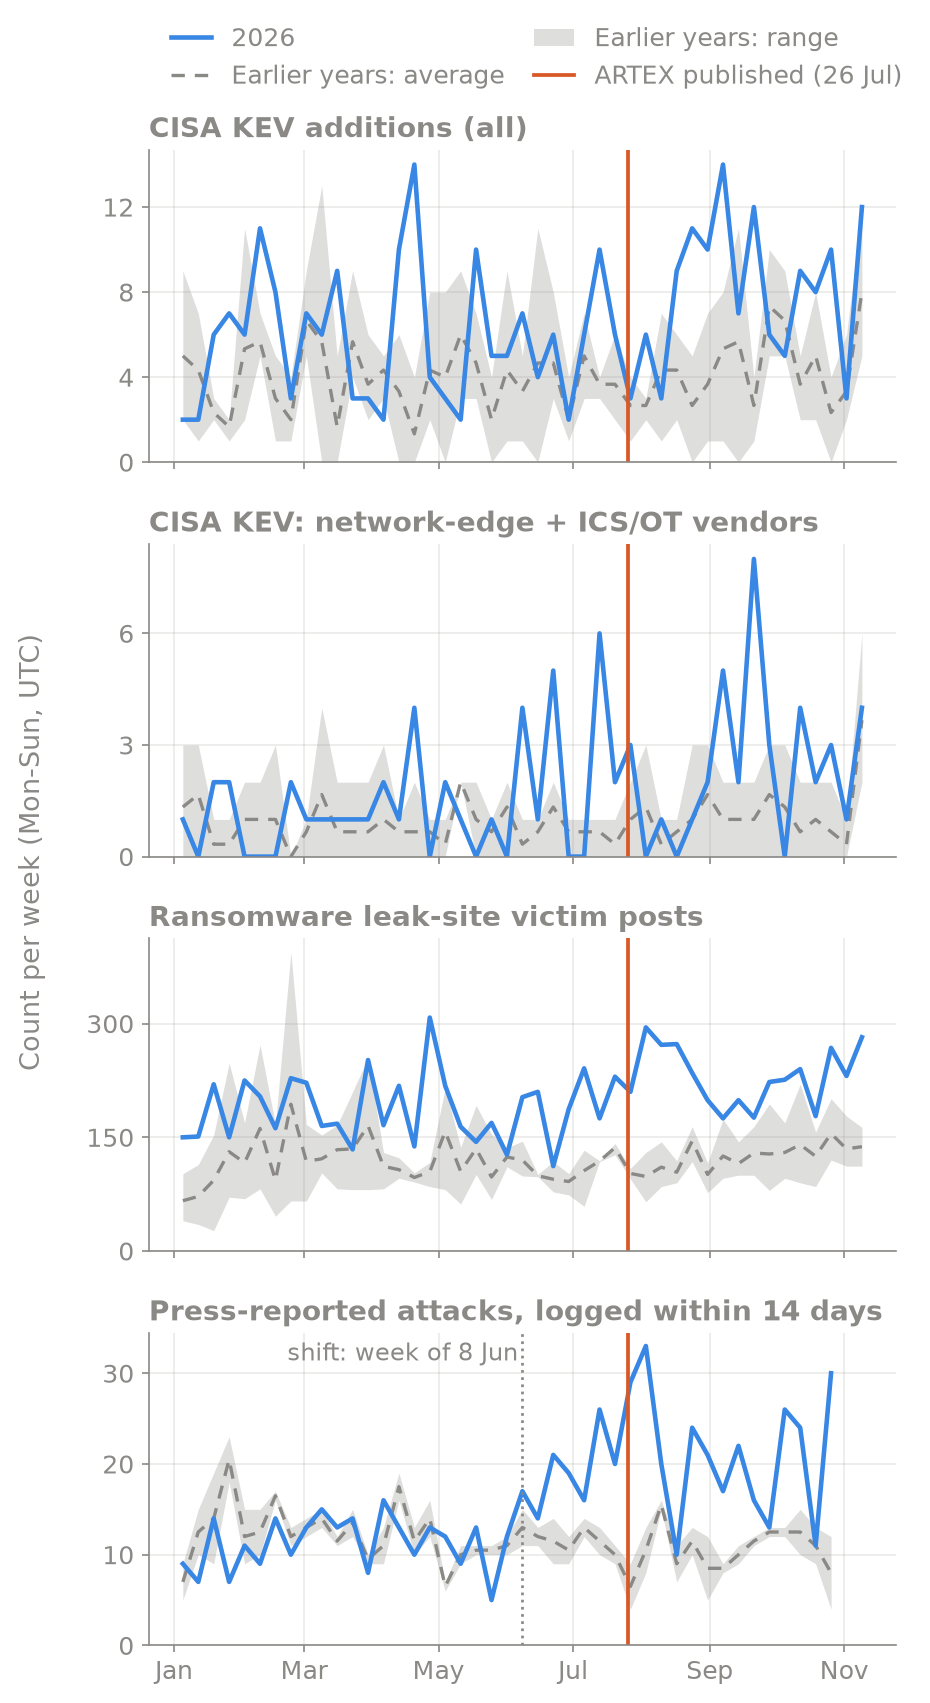
Three of the four main series show no detectable break at the release week: tested against every candidate week from mid-2024, the release week ranked 66 of 116 at best, with a smallest p of 0.14.
- KEV, all: rank 109 of 116 (p 0.71). Best single step: a fall in the week of June 16, 2025 (0.58 times).
- KEV, edge and industrial vendors: rank 91 of 116 (p 0.59). Best single step: a rise in the week of June 8, 2026, seven weeks before the release (2.17 times, 95 percent interval 1.16 to 4.08).
- Ransomware posts: rank 66 of 116 (p 0.14). Best single step: a fall in the week of April 7, 2025 (0.70 times). The step at the release week is estimated at 1.33 times (0.99 to 1.80), so a modest step is not ruled out.
- Press, logged within 14 days: the release-week test is significant (p < 0.0001), but the best-fitting step is the week of June 8, 2026, seven weeks before ARTEX was published (2.14 times, 1.72 to 2.65). The release week ranks 71 of 116 in the break test and 17 of 118 in the level-step dating.
Logged within 14 days, the tracker recorded 28 to 66 attacks a month (median 47) from January 2024 to May 2026, then 70, 96, 99, 75 and 99 from June to October 2026. Median logging delays (counting delays of up to 140 days) were 4, 5, 10, 8 and 7 days by half-year from early 2024. They neither confirm nor rule out faster logging, and the data cannot say whether logging sped up or reported attacks rose.
That same week, Anthropic released Claude Fable 5 to the public and Mythos 5 to vetted partners, then switched both off for everyone to comply with a US government order, and another AI lab released a model, with a second following days later. The main report sets out those dates under "Where Anthropic's Claude and Mythos 5 fit"; nothing in this data can say whether any of them is connected to the rise.
The last 20 days
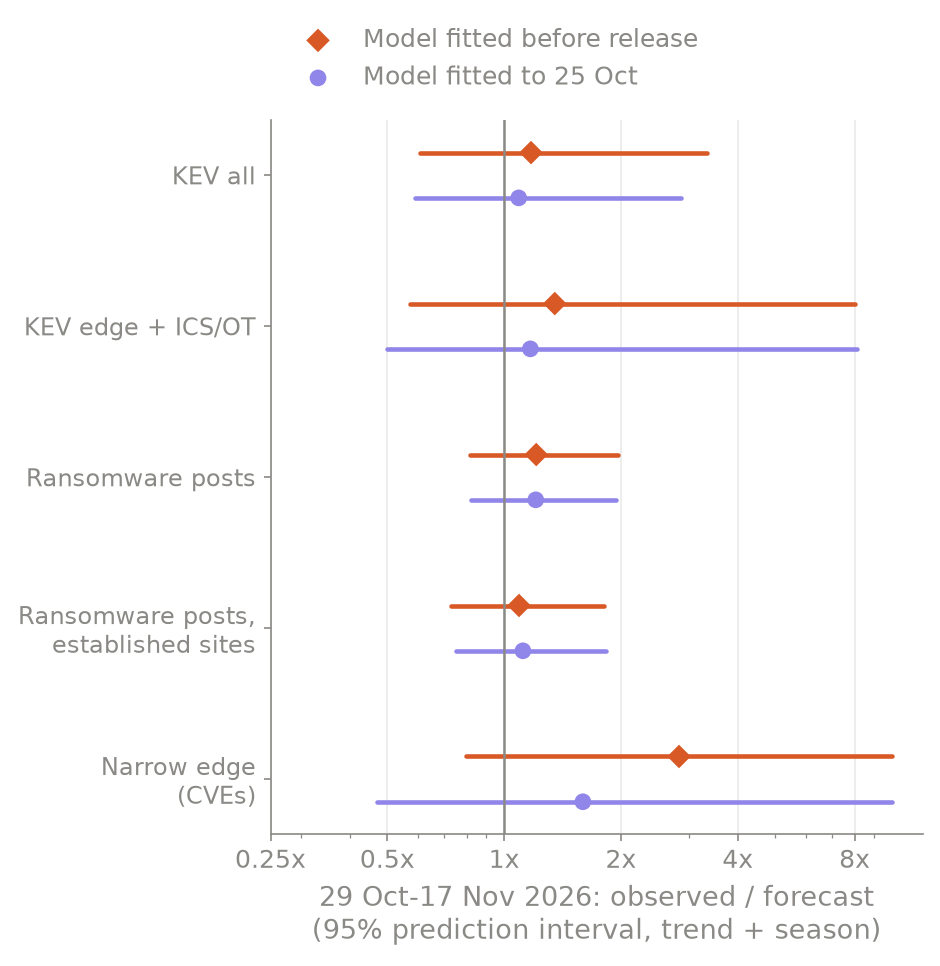
The US outage week in the main report falls inside October 29 to November 17, so we tested those 20 days on their own. Every series shown stayed within its forecast range, whether the model was fitted up to the release or up to October 25.
| Series | 2026 (2023 / 2024 / 2025) | Forecast, model fitted before the release (95% range, p) | Forecast, model fitted to October 25 (95% range, p) |
|---|---|---|---|
| KEV, all | 20 (17 / 13 / 9) | 17.1 (6 to 33, p 0.33) | 18.3 (7 to 34, p 0.40) |
| KEV, edge and industrial vendors | 8 (8 / 4 / 2) | 5.9 (1 to 14, p 0.30) | 6.8 (1 to 16, p 0.39) |
| Ransomware posts | 786 (362 / 354 / 466) | 650 (400 to 964, p 0.17) | 652 (405 to 959, p 0.17) |
| Ransomware, established sites | 603 (331 / 310 / 415) | 552 (333 to 827, p 0.32) | 540 (329 to 801, p 0.29) |
| Narrow edge, CVEs | 5 (7 / 1 / 0) | 1.8 (0 to 6, p 0.080) | 3.1 (0 to 11, p 0.26) |
| Narrow edge, vendor-day events | 4 (2 / 1 / 0) | 1.3 (0 to 4, p 0.066) | 2.4 (0 to 8, p 0.26) |
The press series is not yet complete for these dates and is not shown.
Ransomware posts (786) were the highest for those dates in the four years compared, but about what growth and the usual late-autumn rise predict. Of them, 159 came from leak sites first recorded during the window or the 30 days before it, against 12, 29 and 14 in the same dates of 2023 to 2025, and 26 gangs first recorded after the release supplied 213 of them.
Simple comparisons with the same days of earlier years (1.99 times, 1.52 to 2.61) and with this year's pace before the release (1.46 times, 1.10 to 1.94) ignore growth and the late-autumn rise, treat days as independent, and are descriptive only.
The one measure that rose: network-edge devices
Network-edge devices sit where an organization's network meets the internet. We counted KEV entries from edge vendors whose product name marks an edge device: network-edge appliances (such as firewalls, VPN gateways and routers), their management consoles and email gateways. We counted them as flaws (CVEs) and as distinct vendor-day events.
This count did break from its forecast, rising to 27 against about 7 predicted. As distinct vendor-day events, it was 24 against about 6 (p < 0.002). But its definition was written during the analysis, and the result fails the stricter Holm correction for multiple tests (for the CVE count, adjusted p 0.18; 0.015 under Benjamini-Hochberg).
The overall count had begun rising in early 2026, before ARTEX was released: 1 in the last quarter of 2025, then 5 and 9, then 18 in the third quarter. Nine of the 27 are management consoles or email gateways, which do not appear in the same weeks of 2023-2025.
The appliances themselves numbered 18 after the release, against 5 in the 16 weeks before (and 13, 5 and 5 in the same weeks of 2023-2025). The data cannot say why the count rose or who exploited these flaws. That is a timing fact, not evidence of a link.
| Quarter | Narrow edge, CVEs | Vendor-day events |
|---|---|---|
| 2024 Q1 | 7 | 5 |
| 2024 Q2 | 6 | 4 |
| 2024 Q3 | 3 | 3 |
| 2024 Q4 | 6 | 5 |
| 2025 Q1 | 11 | 10 |
| 2025 Q2 | 8 | 7 |
| 2025 Q3 | 6 | 5 |
| 2025 Q4 | 1 | 1 |
| 2026 Q1 | 5 | 4 |
| 2026 Q2 | 9 | 7 |
| 2026 Q3 | 18 | 16 |
| Oct 1 to Nov 17, 2026 | 10 | 9 |
By the date CISA added each flaw. The third quarter of 2026 includes July 1 to 26, before the release.
In 16-week blocks lined up with the release, the count ran 11, 8, 6, 5 and 10 from January 13, 2025 to July 26, 2026, then 27 after the release (as events: 10, 7, 5, 4, 8, then 24). The release-break test gives p 0.004 for both versions, with the release week ranking 35 of 116 (CVEs) and 43 of 116 (events).
Dated the way we dated the press shift, the best single step in the CVE count is in the week of September 7, 2026, six weeks after the release (5.52 times, 2.01 to 15.2), and a step at the release week ranks 2 of 120. As events, the best step is a fall in the week of July 14, 2025, with the release week 5 of 120: with counts this small, single-step dating is unstable.
Definitions tried on KEV: edge or industrial vendor (the main series); edge vendor only; industrial vendor only; edge vendor with an edge-device product name (this measure); the same as vendor-day events; and the same without consoles and gateways (totals only).
Which results survive correction
Of the 32 anomaly tests, 2 survive Holm's correction, both for the press series, and 6 survive Benjamini-Hochberg: those two plus the forecast and break tests for the narrow edge count, as CVEs and as events. The press series' release-week break test is significant only because that series shifted on June 8; the release week itself ranks 71 of 116 candidate weeks.
| Series | Forecast test: p (Holm, BH) | Release-break test: p (Holm, BH) |
|---|---|---|
| KEV, all | 0.10 (1.00, 0.23) | 0.71 (1.00, 0.73) |
| KEV, edge and industrial vendors | 0.19 (1.00, 0.32) | 0.59 (1.00, 0.66) |
| Ransomware posts | 0.22 (1.00, 0.36) | 0.14 (1.00, 0.26) |
| Ransomware, established sites | 0.50 (1.00, 0.60) | 0.34 (1.00, 0.45) |
| Press, logged within 14 days | < 0.002 (survives both) | < 0.0001 (< 0.0001, < 0.0001) |
| Narrow edge, CVEs | 0.003 (0.18, 0.015) | 0.004 (0.23, 0.017) |
| Narrow edge, vendor-day events | < 0.002 (0.11, 0.010) | 0.004 (0.20, 0.015) |
Selected rows. The other anomaly tests (the last-20-days forecasts, and four more sensitivity series: edge vendors only, industrial vendors only, ransomware by attack date and raw press counts) survive neither correction.
ARTEX's spread against unrelated software
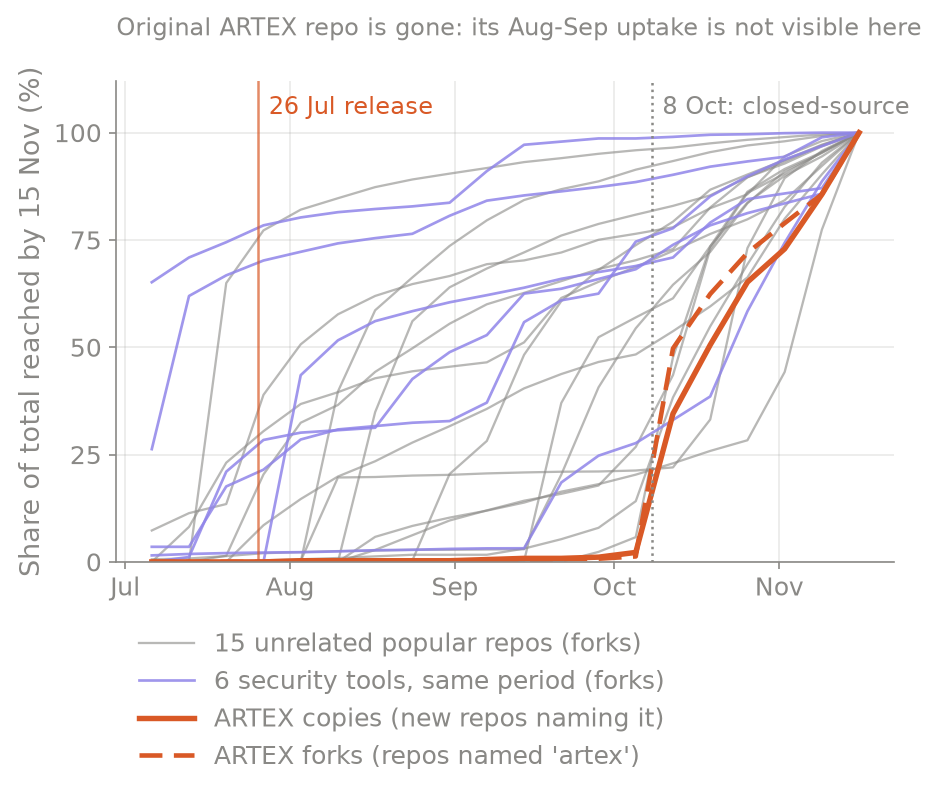
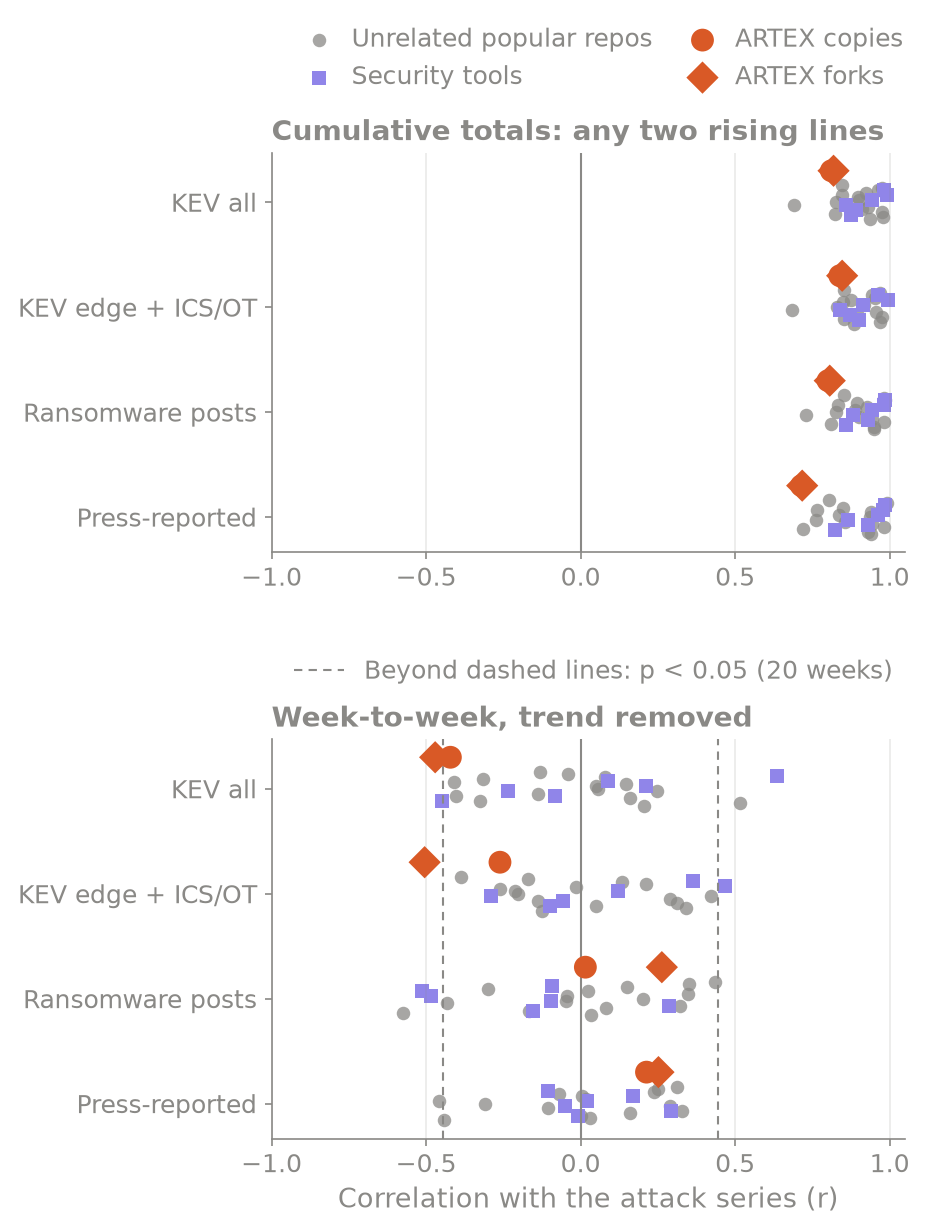
With the original repository gone, we measured ARTEX's spread through copies and forks named after it. Nearly all came late: 97.8 percent of copies and 98.7 percent of forks were made from the week of October 5, around the developer's October 8 statement that ARTEX had gone closed-source, so August and September uptake cannot be measured.
With trends removed, ARTEX ranked in the top two of the 16 in 4 of 32 checks and the bottom two in 7, against 4 each expected by chance; with lags up to 8 weeks, 2 of 16 against 2 expected. The most extreme ARTEX value is negative (-0.53, ARTEX forks against KEV edge and industrial vendors, week-on-week changes). The checks overlap heavily (the two measures correlate at 0.95), and with 15 comparison projects no single check could survive a correction for many tests.
| Attack series | ARTEX copies | ARTEX forks | Range of the 15 unrelated projects |
|---|---|---|---|
| KEV, all | -0.42 | -0.47 | -0.41 to 0.52 |
| KEV, edge and industrial vendors | -0.26 | -0.50 | -0.39 to 0.42 |
| Ransomware posts | 0.02 | 0.26 | -0.58 to 0.43 |
| Press, logged within 14 days | 0.21 | 0.25 | -0.46 to 0.33 |
Correlations with trends removed, no lag. With 20 weeks, a correlation must be larger than 0.44 in either direction to reach p < 0.05 before any correction.
A first check on outages (preliminary)
Unlike the tests above, this check has not had an adversarial review; treat it as a first look. It asks whether outages in general ran above normal when the US outages clustered, and how unusual six in six days is.
It uses public records from January 2023 to November 17, 2026: IODA, a Georgia Tech project that flags country-level internet outages (45 of 46 monthly downloads; the one for September 6 to October 6, 2023 failed), and the status-page histories of GitHub (767 incidents), Zoom (688) and Atlassian (18, too few to test), leaving out scheduled maintenance.
| Record | Oct 29 to Nov 17: 2026 (2023 / 2024 / 2025) | Forecast (95% range, p) | Nov 12 to 17: 2026 (2023 / 2024 / 2025) | Forecast (95% range, p) |
|---|---|---|---|---|
| IODA, country outage-days worldwide | 341 (383 / 198 / 264) | 260 (109 to 483, p 0.19) | 84 (122 / 71 / 40) | 76 (23 to 164, p 0.36) |
| IODA, United States | 0 (0 / 0 / 0) | 0.3 (0 to 3, p 1.0) | 0 (0 / 0 / 0) | 0.1 (0 to 1, p 1.0) |
| GitHub status incidents | 26 (5 / 2 / 14) | 11.0 (3.6 to 20.5, p 0.003) | 5 (2 / 0 / 5) | 3.3 (0 to 8.2, p 0.25) |
| Zoom status incidents | 15 (10 / 4 / 11) | 9.6 (3.4 to 18.8, p 0.10) | 9 (3 / 4 / 1) | 3.0 (0 to 7.2, p 0.007) |
Growth-and-season model fitted to the weeks before July 27, 2026; one-sided p, adjusted for autocorrelation. A model fitted to October 25 gives similar results.
Worldwide internet outages: no excess. IODA's count was within its forecast range in both windows, and it recorded no country-level outage in the United States in either window, in 2026 or earlier years. It measures country-wide connectivity, so one company's service failing would not normally register.
GitHub: above forecast over 20 days, not in the outage week. GitHub posted 26 incidents against about 11 forecast, or 19 against 5, 2 and 11 without Copilot and AI-model incidents. But its count was already rising (14 in 2025), it sits inside the wide range for a normal year, and where GitHub gives causes they are technical, such as a degraded job-queue cluster or a "surge in anonymous users".
Zoom: above forecast in the outage week. Zoom posted 9 incidents in November 12 to 17 against about 3 forecast. It attributes one November 12 incident, affecting its Microsoft integrations, to "an underlying vendor issue": a problem at one provider can surface at another, so outages are not fully independent.
Six outages in six days. The main report describes six US outages from November 12 to 17: Microsoft 365, the FAA ground stop, Chase and other banks, United, the NSA network and Apple. We found no public dataset of nationally reported US outages to say how often that happens, so we simulated how often chance alone would put five or six into some six-day stretch, for a range of assumed yearly rates.
| Assumed outages a year | Expected in any 6 days | 5 or more in 6 days, within one year | 5 or more, January 2023 to November 17, 2026 | 6 or more, within one year | 6 or more, January 2023 to November 17, 2026 |
|---|---|---|---|---|---|
| 6 | 0.10 | under 0.01% | 0.01% | under 0.01% | under 0.01% |
| 12 | 0.20 | 0.02% | 0.2% | under 0.01% | under 0.01% |
| 18 | 0.30 | 0.3% | 1.1% | 0.02% | 0.07% |
| 24 | 0.39 | 1.1% | 4.1% | 0.09% | 0.3% |
| 36 | 0.59 | 6.4% | 23% | 0.7% | 2.8% |
| 52 | 0.85 | 27% | 71% | 5.0% | 19% |
Share of 20,000 simulated runs per cell with at least one six-day stretch holding that many outages, assuming independent outages at a constant rate. The five-or-more columns allow for one of the six not counting.
On these assumptions the cluster is unusual only if outages this large normally happen fewer than about 25 to 35 times a year, and no dataset we found gives the real rate.
Why this check is weak.
- The cluster was picked after the fact, and a pattern chosen after seeing it looks rarer than it is.
- Media attention after the first outage raises the chance that later ones are reported.
- Knock-on outages, like Zoom's, break the independence the simulation assumes, which makes clusters more common.
- We ran many comparisons here (about 5 series, 2 windows, 3 baselines) with no correction, so single p-values below 0.05 are weak.
- Status pages are self-reported, and practice changes over time. IODA events seen by two or more of its sources fell (2 against 11, 10 and 13), which looks like a coverage change; we do not interpret it.
- Nothing here covers relay or field-equipment networks.
- We could not obtain the Energy Department's OE-417 grid disturbance reports (the public site did not resolve), and Google Cloud, Slack and Cloudflare publish too little history to set a base rate.
- Two further outages reported in the same days were left out because we could not verify them.
Limitations
- Every attack series measures discovery, confirmation or reporting, not when or how attacks happened. None can attribute an attack to ARTEX or anyone else, or tell sabotage from ordinary failure; whether any outage was an attack is not tested here.
- With 20 weekly points (18 for the press series), a correlation must exceed 0.44 in size to reach p < 0.05 before any correction, and lags of up to 8 weeks are short for measures that trail real activity by weeks to months. Only a strong link could have been detected, and finding no link is not proof that none exists.
- The ARTEX measures count GitHub copies and forks made after the original repository disappeared, almost all in the October mirroring wave: availability, not use in attacks.
- The comparison projects are measured by forks, ARTEX by copies and forks named after it, and all 15 launched with a burst between mid-June and mid-August, unlike ARTEX's late surge; we did not build a set matched on timing.
- Ransomware and press counts grow with tracker coverage as well as real activity, so comparisons with earlier years overstate any 2026-specific change; that is why the forecast is the main test.
- Many tests were run. The few that survive correction are set out under "Which results survive correction", with their caveats; the ARTEX correlation checks survive neither correction (smallest p 0.06).
- The narrow edge definition was written during the analysis with the post-release entries visible.
- The last-20-days daily comparisons treat days as independent and are descriptive only. Recent days are provisional as the trackers backfill.
How to reproduce
The analysis code is not published, but every input is public. Every number here comes from the results files the scripts write.
- CISA KEV: the catalog's JSON feed, version 2026.11.17, by date added; models start in 2023.
- ransomware.live: from its version 2 API, monthly victim lists (api.ransomware.live/v2/victims/YEAR/MONTH), January 2021 to November 2026, and the press-reported attack list (api.ransomware.live/v2/allcyberattacks). Posts are dated when ransomware.live recorded them, except on two bulk-import days (July 26, 2023 and April 19, 2024), where the attack date is used.
- GitHub, read-only through its REST API (see the search documentation): repositories mentioning "artex" by creation date, including README text; weekly search totals for forks named "artex"; and each comparison project's fork list. Of the 1,000 most relevant fork results, 932 are about the tool; we do not extrapolate that share.
- Outages: IODA's version 2 country-level outage events in monthly windows, and the status-page histories linked above.
The 15 unrelated projects are the most-starred repositories created June 15 to August 15, 2026 with over 1,000 stars, after dropping those with over 60,000 forks, no description or topics, or any security, offensive or evasion keyword, and keeping at most one project from the DeepSeek Harness plugin ecosystem: deepseek-ai/deepseek-harness, bilawalsidhu/gods-eye-view, boykopovar/AnyPS5, JustVugg/colibri, baidu/Unlimited-OCR, hypit-ai/hypit, xai-org/grok-build, milind-soni/OpenMausBot, lexmount/moli, firecrawl/anydoc, DuarteSantos8/openGym, latent-spaces/brag, img2threejs/img2threejs, Vincentwei1021/video-shotcraft and xerj-org/xerj.
The 6 security tools are the top five by stars from pentest, security, red-team and vulnerability searches over the same dates, plus the most-starred AI penetration-testing agent. A repository counts as about ARTEX when its name, description or topics mention ARTEX in a security or penetration-testing context, there or in its README.
The scripts, in Python with statsmodels, SciPy, pandas, NumPy and Matplotlib, download and cache the data, query GitHub read-only, select the comparison projects, build daily and weekly series, run the tests above and draw the charts. A separate script builds the outage series with the same model functions and runs the six-day simulation.
The attack and GitHub data were pulled on November 18, 2026, about 02:00 to 03:00 UTC (the evening of November 17, US time), with November 17 the last complete day; windows and models are as in "How we tested it". Recent days change as the trackers backfill, so a later pull will differ slightly.
Update log: This is a developing story. We'll add new findings here as the FAA forensics, vendor advisories and official root-cause reports come in. 18 Nov 2026: added "Where Anthropic's Claude and Mythos 5 fit", including whether restricting Mythos helped or hurt, the publisher's view and a skeptical reading, a key point, 21 timeline entries (AI models, the June 2026 US order, ARTEX's developer, related attacks, and the November 16 Optimizely and Coles incidents), and an item to "What would settle it". Later on 18 Nov: added the Director of National Intelligence's statements and House testimony, the FBI's clarification on ARTEX, the FAA's router pause and the state of its investigation, the Secretary of State's remarks, an unconfirmed report that fixes for AI-found flaws caused the outages, updates from Equinor and Optimizely, Visa's statement, earlier Amazon, Google and StepSecurity reports on ARTEX, a GAO report on AI chatbots, and 14 timeline entries. Last updated 18 Nov 2026.